Visualizing Combinatorial Risks of Flood Plains in Saint John, New Brunswick
The New Brunswick Community College – Centre for Applied Research in Mobile & Ubiquitous Computing
Contents
[hide]- 1 Visualizing Combinatorial Risks of Flood Plains in Saint John, New Brunswick: Evacuation Routes and Fire Station Service Zones
- 1.1 Road Flooding Events in Saint John
- 1.2 The Context: Saint John, New Brunswick
- 1.3 Flood Plains in Saint John, New Brunswick
- 1.4 Combinatorial Risk of Evacuation Routes and Flood Plains in Saint John, New Brunswick
- 1.5 Combinatorial Risk of Fire Station Zones and Flood Plains in Saint John, New Brunswick
- 1.6 Conclusions
- 1.7 Opportunities for Using Real-time Open Data
- 1.8 Future Work
- 1.9 Open Data Sources Used
- 1.10 Technologies Employed, Including Exploratory Work
- 1.11 Authors
- 1.12 Acknowledgements
- 1.13 Contact
Visualizing Combinatorial Risks of Flood Plains in Saint John, New Brunswick: Evacuation Routes and Fire Station Service Zones
Data Visualizations Derived from the City of Saint John Open Data Catalogue
Rezk Bouras [1] (lead), Joe Marriott [1,2], William McIver Jr. [1]
[1] Mobile First Technology Initiative, New Brunswick Community College, Saint John & Fredericton, NB, Canada
[2] Information Technology Program, New Brunswick Community College, Saint John, NB
Rezk.bouras@nbcc.ca (contact), Joe.marriott@nbcc.ca, bill.mciver@nbcc.ca
Road Flooding Events in Saint John
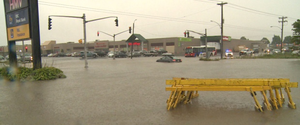
On September 11, 2015, parts of the City of Saint John, New Brunswick experienced significant flooding due to heavy rainfall. This flooding led, in turn, to the closure of key evacuation routes, traffic accidents, and damage to property.
Source: http://www.cbc.ca/news/canada/new-brunswick/new-brunswick-weather-heavy-rain-sept-11-1.3223778
This infographic employs open data to examine potential impacts of the Saint John flood plain on designated evacuation routes and fire station service zones.
Gaps in open data suggest the need open data sources that could improve analysis of and real time responses to flooding events.
Figure 1. Flooding on September 11, 2015 in Saint John and its impacts on traffic.
Source: http://www.cbc.ca/news/canada/new-brunswick/new-brunswick-weather-heavy-rain-sept-11-1.3223778
Research topics
data visualization, open data, situation awareness
Objectives
Visualize the extents of potential flooding in Saint John, New Brunswick. Visualize specific risks due to this flooding. Visualize combinatorial risks due to this flooding. Identify opportunities to improve monitoring and response to flooding using open data sources in the City of Saint John's Open Data Catalogue.
Risk :- “effect of uncertainty on objectives.”
“Risk is often expressed in terms of a combination of the consequences of an event (including changes in circumstances) and the associated likelihood [...] of occurrence.”
Source: ISO 31000:2009(en), https://www.iso.org/obp/ui/#iso:std:iso:31000:ed-1:v1:en:term:2.19.
Combinatorial Risk :- a risk that arises only through the combination of multiple risks.
The Context: Saint John, New Brunswick
Saint John is the largest city in New Brunswick and the second largest city in the Maritime provinces. It is known as the Fundy City due to its location on the north shore of the Bay of Fundy at the mouth of the Saint John River, as well as being the only city on the bay. In 1785, Saint John became the first incorporated city in Canada.
Saint John had a population of 70,063 in 2011 over an area of 315.82 square kilometres (121.94 sq mi). The Saint John metropolitan area covers a land area of 3,362.95 square kilometres (1,298.44 sq mi) across the Caledonia Highlands, with a population (as of 2011) of 127,761.
Source: https://en.wikipedia.org/wiki/Saint_John,_New_Brunswick
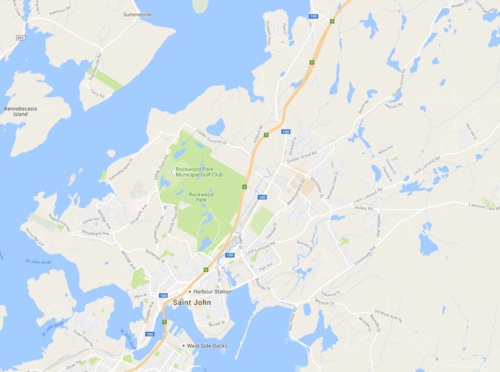
Map 1. The City of Saint John, New Brunswick. Source: http://maps.google.com
Flood Plains in Saint John, New Brunswick
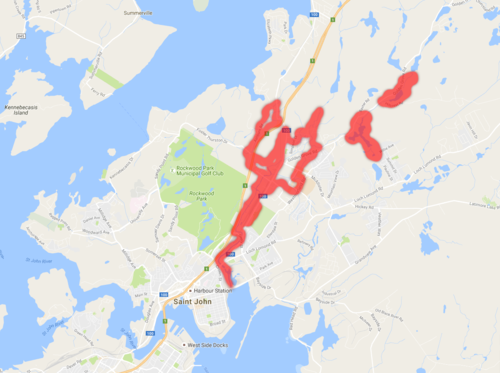
The City of Saint John has several zones that are subject to flooding during weather events. The following map shows those zones in red. This is the primary risk with which we are examining other risk combinations.
Map 2. Flood plains in Saint John, New Brunswick.
Combinatorial Risk of Evacuation Routes and Flood Plains in Saint John, New Brunswick
In April 2010, the City of Saint John designated evacuation routes “to identify the safest and most expedient routes to follow should need arise to evacuate a specific area of the city” in consultation with Saint John EMO and the Saint John Police Force.
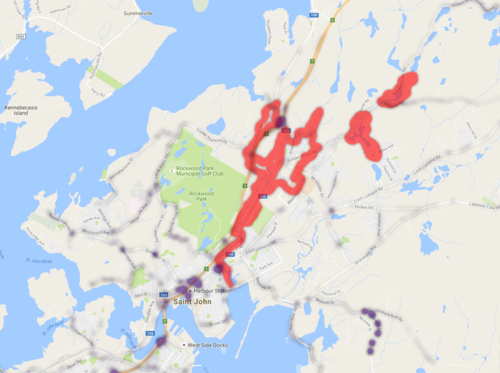
What risks do the flood plains pose to these evacuation routes? The following map shows the evacuation routes superimposed on the previous flood plain map, indicated by the darker splotches.
Source: http://www.saintjohn.ca/en/home/cityhall/protectiveservices/emergencymanagement/evacuationsigns.aspx
Map 3. Evacuation routes superimposed on flood plains in Saint John, New Brunswick.
Combinatorial Risk of Fire Station Zones and Flood Plains in Saint John, New Brunswick
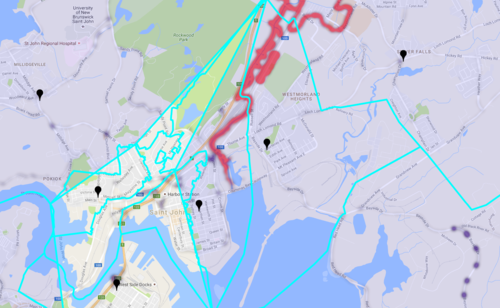
In addition to blocking evacuation routes, flooding has the potential to create barriers that prevent a fire station from servicing their entire zone. The following map shows the positions of each fire station and the extents of their respective service zones in relation to flood zones and evacuation routes.
Map 4. Fire stations, fire service zones, and evacuation routes superimposed on flood plains in Saint John, New Brunswick.
Conclusions
- Flooding zones exist along main arterials in in Saint John, New Brunswick.
- Our visualizations show combinatorial risks due to flooding in these zones:
- Where evacuation routes may be blocked
- Where fire station service zones may be interrupted.
- The application programming interfaces (APIs) we used to produce the maps greatly limited our ability to produce clear markers and routes from the evacuation route data.
Opportunities for Using Real-time Open Data
- Our visualizations are only able to show combinatorial risks – not actualization of those risks due to specific flooding events.
- We are not able, for example, to show the specific realizations of those risks during the September 11, 2015 flooding event:
- Which evacuation routes were actually blocked during that flooding event
- Which fire station service zones were interrupted during that flooding event
- A cost-effective real-time rainfall data collection grid could now be implemented in Saint John using the following: Industrial Internet of Things (IIoT)
- Various wireless backhaul technologies
- Flood modelling combined with real-time rainfall monitoring and analysis could be used to do the following:
- Drive real-time versions of our visualizations
- Drive real-time notification of city officials and first responders to actualization of these risks
Future Work
- We are interested in exploring applications of wireless sensor networking technology and real-time data collection to flood monitoring and notification.
- We are interested in developing a historical version of these visualizations that would allow the user to filter weather data by date and produce the corresponding risk visualizations.
- We are interest in improving upon the APIs we used to produce this infographic, so as to produce clearer and more flexible visualizations.
Open Data Sources Used
- “Open Data Catalogue | Flood Plain.” Esri Shapefile, The City of Saint John, April 2015. [Online]. Available: http://www.saintjohn.ca/en/home/cityhall/financeadmin/informationtechnology/opendata_catalogue/dataset_floodplain.aspx.
- “Open Data Catalogue | Evacuation Routes.” Esri Shapefile, The City of Saint John, April 2015. [Online]. Available: http://www.saintjohn.ca/en/home/cityhall/financeadmin/informationtechnology/opendata_catalogue/dataset_evacuationroutes.aspx.
- “Open Data Catalogue | Fire Stations.”Esri Shapefile, The City of Saint John, September 2015. [Online]. Available: http://www.saintjohn.ca/en/home/cityhall/financeadmin/informationtechnology/opendata_catalogue/dataset_fire_stations.aspx.
- “Open Data Catalogue | Fire Zones.” Esri Shapefile, The City of Saint John, April 2015.[Online]. Available: http://www.saintjohn.ca/en/home/cityhall/financeadmin/informationtechnology/opendata_catalogue/dataset_firezones.aspx.
Technologies Employed, Including Exploratory Work
- Google Maps APIs were used for final map processing and visualization. [1]
- Javascript is the language used with the Google APIs.
- Pyshp was used for reading ESRI shape files with excellent results. [ https://pypi.python.org/pypi/pyshp ]
- Pyproj was used for converting coordinate systems with excellent results. [ https://pypi.python.org/pypi/pyproj ]
- Numpy was used for generating arrays with excellent results. [ http://www.numpy.org ]
- Gmplot was used for plotting coordinates onto a google map with mixed results. [ https://pypi.python.org/pypi/gmplot ]
- Folium was tried for plotting coordinates onto a google map with poor results. [ https://github.com/python-visualization/folium ]
Authors
- Rezk Bouras is a 2016 graduate of the Information Technology program at NBCC Saint John and is currently a Research Technician in the Mobile First Technology Initiative of the New Brunswick Community College. He developed the maps used in this infographic.
- Joe Marriott is Instructor of Information Technology at New Brunswick Community College and holds a secondment with the Mobile First Technology Initiative.
- William McIver, Jr. Is Director of the Mobile First Technology Initiative of the New Brunswick Community College.
Acknowledgements
The New Brunswick Community College Mobile First Technology Initiative is supported by a Natural Sciences and Engineering Research Council of Canada – Industrial Research for Chairs for Colleges grant with additional support from industrial partners IGT, Technology Ventures Corporation, Mariner Partners, T4G, Accreon, and Stellar Learning Strategies. Additional support for the Mobile First Technology Initiative includes grants from the New Brunswick Innovation Fund – Research Technician Initiative; the National Sciences and Engineering Research Council of Canada – Applied Research Tools and Instruments program; Government of New Brunswick – Industry Innovation Challenge, and Government of New Brunswick – Post-Secondary Education, Training and Labour.
See http://nbcc.ca/mobi for more information about the New Brunswick Community College – Mobile First Technology Initiative.
Funders
- Natural Sciences and Engineering Research Council of Canada - Industrial Research Chair for Colleges program
Publications
- Rezk Bouras, Joe Marriott, William McIver Jr., "Visualizing Combinatorial Risks of Flood Plains in Saint John, New Brunswick: Evacuation Routes and Fire Station Service Zones", New Brunswick Community College – Mobile First Technology Initiative, Poster, 2016-11. [PDF]
Contact
William McIver Jr., Ph.D.
NSERC Industrial Research Chair in Mobile & Ubiquitous Computing
Centre for Applied Research in Mobile & Ubiquitous Computing
New Brunswick Community College
Centre for Applied Research in Mobile & Ubiquitous Computing URL: http://wiki.nbcc.mobi
E-mail: bill.mciver@nbcc.ca
Twitter: @mciverNBCC
Blog: http://mciver.mobi/
New Brunswick Community College URL: http://nbcc.ca
Media inquiries
![]() | © Copyright 2017 - 2022. All Rights Reserved.
| © Copyright 2017 - 2022. All Rights Reserved.
The New Brunswick Community College – Centre for Applied Research in Mobile & Ubiquitous Computing is supported by
the Natural Sciences and Engineering Research Council of Canada. ![]()
