Difference between revisions of "Visualizing Combinatorial Risks of Flood Plains in Saint John, New Brunswick"
Bill.mciver (talk | contribs) |
Bill.mciver (talk | contribs) |
||
| Line 23: | Line 23: | ||
Gaps in open data suggest the need open data sources that could improve analysis of and real time responses to flooding events. | Gaps in open data suggest the need open data sources that could improve analysis of and real time responses to flooding events. | ||
| + | |||
[[File:Nbcc_ca_mobi_image-SJ-00.png | 300px ]] | [[File:Nbcc_ca_mobi_image-SJ-00.png | 300px ]] | ||
| Line 29: | Line 30: | ||
Source: http://www.cbc.ca/news/canada/new-brunswick/new-brunswick-weather-heavy-rain-sept-11-1.3223778 | Source: http://www.cbc.ca/news/canada/new-brunswick/new-brunswick-weather-heavy-rain-sept-11-1.3223778 | ||
| − | |||
| − | |||
| − | |||
'''Research topics''' | '''Research topics''' | ||
| Line 39: | Line 37: | ||
---- | ---- | ||
| − | + | Objectives | |
| + | |||
| + | Visualize the extents of potential flooding in Saint John, New Brunswick. | ||
| + | Visualize specific risks due to this flooding. | ||
| + | Visualize combinatorial risks due to this flooding. | ||
| + | Identify opportunities to improve monitoring and response to flooding using open data sources in the | ||
| + | City of Saint John's Open Data Catalogue. | ||
| + | |||
| + | Risk :- “effect of uncertainty on objectives.” | ||
| + | |||
| + | “Risk is often expressed in terms of a combination of the consequences of an event (including changes in circumstances) and the associated likelihood [...] of occurrence.” | ||
| + | |||
| + | Source: ISO 31000:2009(en), https://www.iso.org/obp/ui/#iso:std:iso:31000:ed-1:v1:en:term:2.19. | ||
| + | |||
| + | Combinatorial Risk :- a risk that arises only through the combination of multiple risks. | ||
| + | |||
| + | === The Context: Saint John, New Brunswick === | ||
| + | Saint John is the largest city in New Brunswick and the second largest city in the Maritime provinces. It is known as the Fundy City due to its location on the north shore of the Bay of Fundy at the mouth of the Saint John River, as well as being the only city on the bay. In 1785, Saint John became the first incorporated city in Canada. | ||
| + | |||
| + | Saint John had a population of 70,063 in 2011 over an area of 315.82 square kilometres (121.94 sq mi). The Saint John metropolitan area covers a land area of 3,362.95 square kilometres (1,298.44 sq mi) across the Caledonia Highlands, with a population (as of 2011) of 127,761. | ||
| + | |||
| + | Source: https://en.wikipedia.org/wiki/Saint_John,_New_Brunswick | ||
| + | |||
| + | |||
| + | [[File:Nbcc_ca_mobi_map-SJ-01.png | 500px ]] | ||
| + | |||
| + | Map 1. The City of Saint John, New Brunswick. Source: http://maps.google.com | ||
| + | |||
| + | |||
| + | ---- | ||
'''Collaborators''' | '''Collaborators''' | ||
* | * | ||
Revision as of 09:10, 15 April 2017
// Place. Standard NBCC.ca Header here //
Contents
Visualizing Combinatorial Risks of Flood Plains in Saint John, New Brunswick Evacuation Routes and Fire Station Service Zones
Data Visualizations Derived from the City of Saint John Open Data Catalogue
Rezk Bouras [1] (lead),  Joe Marriott [1,2],  William McIver, Jr. [1]
[1] Mobile First Technology Initiative, New Brunswick Community College, Saint John & Fredericton, NB, Canada
[2] Information Technology Program, New Brunswick Community College, Saint John, NB
Rezk.bouras@nbcc.ca (contact), Joe.marriott@nbcc.ca, bill.mciver@nbcc.ca
Road Flooding Events in Saint John
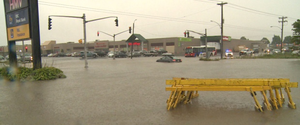
On September 11, 2015, parts of the City of Saint John, New Brunswick experienced significant flooding due to heavy rainfall. This flooding led, in turn, to the closure of key evacuation routes, traffic accidents, and damage to property.
Source: http://www.cbc.ca/news/canada/new-brunswick/new-brunswick-weather-heavy-rain-sept-11-1.3223778
This infographic employs open data to examine potential impacts of the Saint John flood plain on designated evacuation routes and fire station service zones.
Gaps in open data suggest the need open data sources that could improve analysis of and real time responses to flooding events.
Figure 1. Flooding on September 11, 2015 in Saint John and its impacts on traffic.
Source: http://www.cbc.ca/news/canada/new-brunswick/new-brunswick-weather-heavy-rain-sept-11-1.3223778
Research topics
data visualization, open data, situation awareness
Objectives
Visualize the extents of potential flooding in Saint John, New Brunswick. Visualize specific risks due to this flooding. Visualize combinatorial risks due to this flooding. Identify opportunities to improve monitoring and response to flooding using open data sources in the City of Saint John's Open Data Catalogue.
Risk :- “effect of uncertainty on objectives.”
“Risk is often expressed in terms of a combination of the consequences of an event (including changes in circumstances) and the associated likelihood [...] of occurrence.”
Source: ISO 31000:2009(en), https://www.iso.org/obp/ui/#iso:std:iso:31000:ed-1:v1:en:term:2.19.
Combinatorial Risk :- a risk that arises only through the combination of multiple risks.
The Context: Saint John, New Brunswick
Saint John is the largest city in New Brunswick and the second largest city in the Maritime provinces. It is known as the Fundy City due to its location on the north shore of the Bay of Fundy at the mouth of the Saint John River, as well as being the only city on the bay. In 1785, Saint John became the first incorporated city in Canada.
Saint John had a population of 70,063 in 2011 over an area of 315.82 square kilometres (121.94 sq mi). The Saint John metropolitan area covers a land area of 3,362.95 square kilometres (1,298.44 sq mi) across the Caledonia Highlands, with a population (as of 2011) of 127,761.
Source: https://en.wikipedia.org/wiki/Saint_John,_New_Brunswick
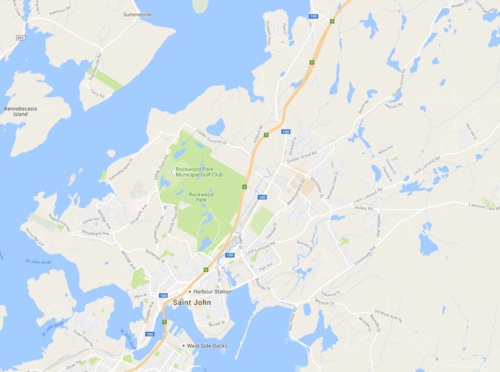
Map 1. The City of Saint John, New Brunswick. Source: http://maps.google.com
Collaborators
Funders
Demonstrations
- [[ | ]]
// Place links here to screen shots, videos, or URLs to running systems when possible. //
Publications
- [[ | ]]
Source code
- [[ | ]]
Project contact
William McIver Jr.

